Key Takeaways
- Building real-world SQL projects is crucial for a strong data portfolio, showcasing practical skills to potential employers.
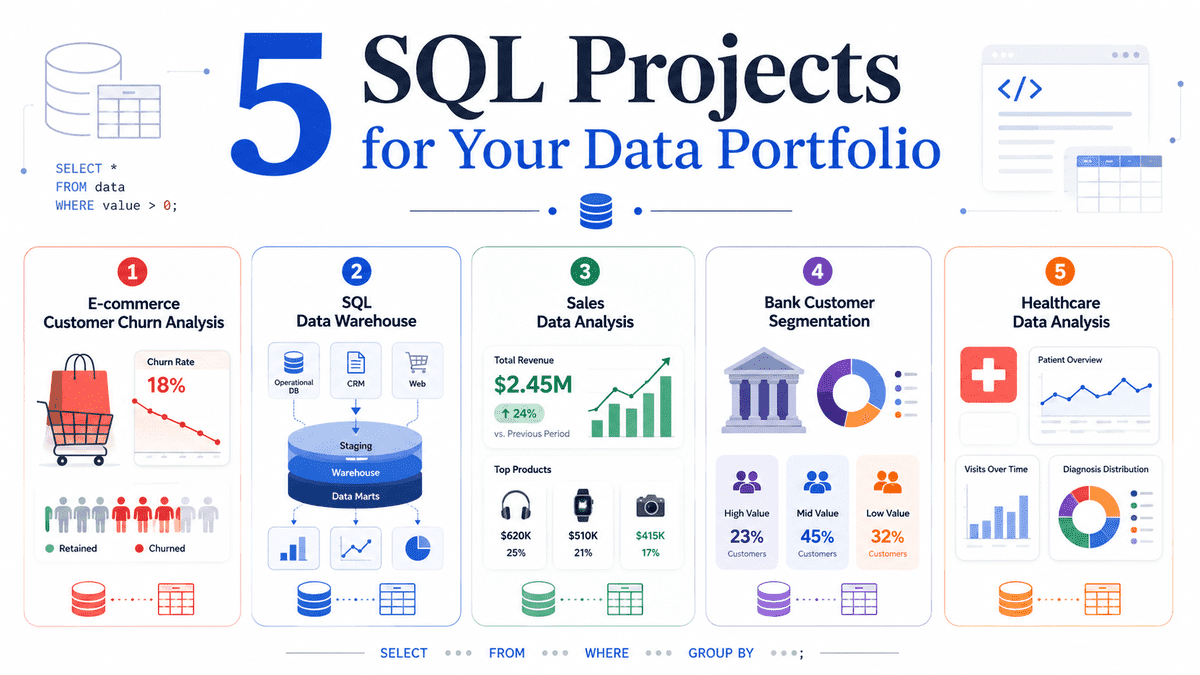
- The five projects (customer churn, data warehousing, sales analysis, banking segmentation, healthcare analytics) cover a broad range of essential SQL techniques and business applications.
- Utilize public datasets from platforms like Kaggle, UCI Machine Learning Repository, and data.gov to practice and demonstrate your analytical abilities.
- Each project helps build a foundation for advanced data analysis and machine learning tasks by honing data cleaning, transformation, and insight generation skills.
If you're looking to kickstart or advance your career in data, whether as a data analyst, data scientist, or an AI/ML engineer, mastering SQL is non-negotiable. It's the universal language for interacting with databases, and practically every data-driven role requires solid SQL skills for data retrieval, manipulation, and analysis. While online courses and theoretical knowledge are a good start, nothing beats hands-on project experience to truly solidify your understanding and showcase your capabilities to potential employers. This guide walks you through five practical, real-world SQL projects designed to beef up your data portfolio and prepare you for the challenges of working with data, including those that feed into AI and machine learning models.
These projects are not just about writing queries; they're about thinking like a data professional. You'll learn to translate business questions into technical problems, clean messy data, extract meaningful insights, and even set the stage for more advanced analytical techniques like predictive modeling. Let's dive into these essential SQL projects.
Why Real-World SQL Projects Matter for Your Portfolio
In today's competitive job market, employers are looking for more than just theoretical knowledge. They want to see that you can apply your skills to solve actual business problems. SQL projects demonstrate your ability to:
- Extract and Manipulate Data: Show you can pull relevant information from complex databases and transform it into a usable format.
- Solve Business Problems: Prove you can understand business questions and use data to find answers.
- Clean and Prepare Data: Highlight your attention to detail and ability to handle imperfect, real-world data.
- Generate Insights: Go beyond simple queries to uncover trends, patterns, and actionable recommendations.
- Build a Foundation for AI/ML: Data cleaning, feature engineering, and understanding data distributions using SQL are critical precursors to building effective machine learning models.
The projects we'll cover are designed to touch upon different aspects of data analysis and database management, making your portfolio diverse and impactful.
Project 1: Customer Churn Analysis
Customer churn, or customer attrition, is a critical metric for businesses, especially in subscription-based models or any industry where customer retention is key. Losing customers directly impacts revenue and growth. This project focuses on identifying why customers leave and what patterns lead to churn, providing insights that can help businesses improve retention strategies.
Project Goal
Analyze customer behavior and demographic data to identify factors contributing to churn and predict which customers are at risk of leaving. The ultimate goal is to provide actionable insights for customer retention.
Key SQL Concepts Involved
GROUP BY and Aggregate Functions (COUNT, AVG, SUM): To calculate churn rates by various segments.CASE WHEN statements: For categorizing data (e.g., creating tenure groups, identifying churned vs. non-churned customers).- Filtering (
WHERE, HAVING): To focus on specific customer segments or behaviors.
- Joins: If customer data is spread across multiple tables (e.g., demographics, subscription details, transaction history).
- Date Functions: To calculate customer tenure or days since last activity.
- Subqueries and CTEs (Common Table Expressions): For more complex analysis, like identifying high-value customers or calculating churn rates over time.
Step-by-Step Approach (High-Level)
- Data Acquisition: Find a suitable customer churn dataset. Public datasets are available on platforms like Kaggle, often for telecom or e-commerce companies.
- Database Setup: Load the dataset into your chosen SQL database (e.g., PostgreSQL, MySQL, SQL Server, SQLite). Create tables with appropriate data types.
- Data Cleaning and Preparation:
- Check for missing values and decide how to handle them (e.g., imputation, removal).
- Identify and handle duplicate records.
- Standardize data formats (e.g., `item_fat_content` values like 'LF', 'low fat', 'reg' to 'Low Fat', 'Regular').
- Exploratory Data Analysis (EDA) with SQL:
- Calculate the overall churn rate.
- Analyze churn rates by different customer attributes: contract type, payment method, tenure, monthly charges, support availability, gender, age, city.
- Identify the top reasons for churn if available in the dataset.
- Segment customers (e.g., by tenure, spending habits) to find high-value customers at risk.
- Insight Generation: Summarize your findings. For example, "Month-to-month contracts have the highest churn rate (45%), while two-year contracts show the lowest (2.4%)."
This project directly supports AI/ML by providing the cleaned and segmented data needed for churn prediction models, where SQL can even be used to define features and assign churn labels.
Project 2: Building a Data Warehouse
A data warehouse is a central repository of integrated data from one or more disparate sources, used for reporting and data analysis. Building one from scratch demonstrates strong data engineering skills, including ETL (Extract, Transform, Load) processes and data modeling.
Project Goal
Design and implement a modern data warehouse using SQL to consolidate data from various sources (e.g., sales, customer, product data) for analytical reporting and informed decision-making.
Key SQL Concepts Involved
- DDL (Data Definition Language):
CREATE TABLE, ALTER TABLE, DROP TABLE for defining schema.
- DML (Data Manipulation Language):
INSERT INTO, UPDATE, DELETE for loading and managing data.
- ETL Concepts: Extracting raw data, transforming it (cleaning, aggregating, joining), and loading it into fact and dimension tables.
- Data Modeling: Understanding Star Schema or Snowflake Schema, creating fact tables (e.g., Sales Fact) and dimension tables (e.g., Customer Dimension, Product Dimension, Date Dimension).
- Constraints: Primary Keys, Foreign Keys to maintain data integrity and relationships.
- Views: To simplify complex queries for reporting purposes.
- Indexing: To optimize query performance on large datasets.
Step-by-Step Approach (High-Level)
- Requirements Analysis: Understand the business needs for reporting and analytics. What questions will the data warehouse answer?
- Data Source Identification: Locate raw data sources (e.g., CSV files from an ERP system, a CRM database). For practice, use sales and customer data from Kaggle or sample databases like AdventureWorks or Bike Store Relational Database.
- Data Architecture Design: Plan your data warehouse schema (e.g., Medallion Architecture: Bronze, Silver, Gold layers).
- Bronze Layer: Raw, untransformed data.
- Silver Layer: Cleaned, standardized, and conformed data.
- Gold Layer: Aggregated and modeled data (fact and dimension tables) ready for reporting.
- Database and Schema Creation: Use DDL statements to create your database and tables for each layer.
- ETL Pipeline Development:
- Extract: Load raw data into the Bronze layer (e.g., from CSVs using import tools or
COPY commands).
- Transform: Write SQL scripts to clean, normalize, join, and aggregate data to move it from Bronze to Silver, and then to Gold. This involves handling nulls, duplicates, and creating new features.
- Load: Populate your dimension and fact tables in the Gold layer.
- Reporting and Validation: Write analytical SQL queries against your Gold layer to answer business questions. Verify data integrity and accuracy.
This project is fundamental for data engineers and provides a robust understanding of how data is structured and prepared for large-scale analytics, which is essential for feeding data into machine learning pipelines.
Project 3: Sales Data Analysis
Sales analysis is a universally valuable skill, directly impacting a business's bottom line. This project involves dissecting sales data to uncover performance trends, identify top-selling products, and understand customer purchasing behavior.
Project Goal
Analyze sales transaction data to identify key performance indicators (KPIs), understand sales trends over time, evaluate product performance, and segment customers based on their purchasing habits.
Key SQL Concepts Involved
- Aggregate Functions (
SUM, COUNT, AVG, MAX, MIN): For calculating total sales, average order value, number of transactions, etc.
GROUP BY and ORDER BY: To segment sales data by product, region, customer, or time period and rank performance.- Date Functions (
DATE_TRUNC, EXTRACT): To analyze sales by day, week, month, quarter, or year.
- Joins: To combine sales data with product information, customer demographics, or store details.
- Subqueries and CTEs: For calculating metrics like month-over-month growth, top N products, or customer lifetime value.
CASE WHEN: For creating custom categories or flags, such as sales performance tiers.
Step-by-Step Approach (High-Level)
- Data Acquisition: Obtain a sales dataset. Kaggle offers many sales datasets, such as "Online Retail Data" or "Walmart Sales Data."
- Database Setup and Data Loading: Create your database and tables, then load the sales data.
- Data Cleaning and Preprocessing:
- Handle missing values (e.g., for product categories or customer IDs).
- Correct data types (e.g., ensuring sales amounts are numeric).
- Address inconsistencies (e.g., misspelled product names).
- Core Sales Analysis:
- Calculate total sales, total orders, and average order value.
- Analyze sales trends over time (monthly, quarterly, yearly).
- Identify top-selling products or product categories.
- Analyze sales by region or store location.
- Segment customers by total spending or purchase frequency.
- Advanced Analysis (Optional):
- Calculate year-over-year or month-over-month growth.
- Perform RFM (Recency, Frequency, Monetary) analysis for customer segmentation.
- Identify seasonal sales patterns.
- Reporting and Visualization: Present your findings with clear summaries and, if possible, integrate with a visualization tool like Tableau or Power BI.
This project is excellent for demonstrating business acumen alongside SQL skills. The insights gained can directly inform marketing campaigns, inventory management, and pricing strategies, often serving as critical input for sales forecasting models in AI/ML.
Project 4: Banking Customer Segmentation
Understanding different customer groups is vital for banks to tailor services, manage risk, and improve customer satisfaction. This project involves analyzing banking transaction and demographic data to segment customers based on their behavior and characteristics.
Project Goal
Segment banking customers into distinct groups based on their transaction patterns, account activity, demographics, and financial behavior to enable targeted marketing, personalized service offerings, and improved risk management.
Key SQL Concepts Involved
- CTEs and Subqueries: To break down complex queries into manageable steps, such as calculating aggregate transaction data per customer before segmentation.
- Window Functions (
ROW_NUMBER(), RANK(), NTILE()): For ranking customers or transactions within groups, or dividing them into quantiles.
- Aggregate Functions: To summarize transaction volumes, average balances, loan amounts, etc.
- Joins: To link customer demographics with account and transaction tables.
CASE WHEN: For creating custom segments (e.g., "high-value," "dormant," "active").- Filtering (
WHERE, HAVING): To analyze specific types of transactions or customer groups.
- Date Functions: To analyze account tenure, transaction frequency, or identify dormant accounts.
Step-by-Step Approach (High-Level)
- Data Acquisition: Look for synthetic banking datasets on Kaggle or the UCI Machine Learning Repository. A "Synthetic Banking Dataset" is available on Kaggle with 1.26 million records across multiple tables.
- Database Setup and Data Loading: Create tables for customers, accounts, transactions, loans, etc., and populate them with your dataset.
- Data Cleaning and Feature Engineering:
- Ensure data consistency across tables.
- Calculate new metrics like "average transaction amount," "number of transactions per month," "days since last transaction," or "credit score ranges" using SQL.
- Segmentation Logic Development:
- Identify high-value customers based on total balance or transaction volume.
- Categorize accounts as active, dormant, or at-risk based on transaction frequency and recency.
- Segment customers by demographics (age, region) and financial products used (loans, cards).
- Analyze regional banking performance and transaction patterns.
- Insight Generation: Summarize the characteristics of each customer segment. For example, "Customers with high transaction frequency and large average balances are typically young professionals residing in urban areas."
This project is excellent for showcasing analytical thinking in a financial context. Customer segmentation is a common preprocessing step for many AI/ML applications in fintech, such as personalized recommendations, credit scoring, and fraud detection.
Project 5: Healthcare Analytics
Healthcare data is complex and sensitive, making it an excellent domain to demonstrate your ability to work with meaningful, real-world data while adhering to data governance principles. This project involves analyzing patient records, medical conditions, and billing information to uncover trends and insights.
Project Goal
Analyze healthcare data to identify common medical conditions, understand patient demographics, track hospital performance, and analyze billing patterns to improve healthcare delivery and resource allocation.
Key SQL Concepts Involved
- Joins: To combine data from patient records, admission details, medical conditions, and billing tables.
- Aggregate Functions: To count common conditions, sum billing amounts, or average patient stays.
GROUP BY and ORDER BY: To rank hospitals by patient volume, conditions, or average billing.- Filtering (
WHERE): To analyze specific medical conditions, age groups, or admission types.
- Subqueries and CTEs: For calculating complex metrics like readmission rates or cost per condition.
- Date Functions: To analyze admission trends, length of stay, or patient visit frequency.
Step-by-Step Approach (High-Level)
- Data Acquisition: Seek out synthetic or anonymized healthcare datasets. Resources include the Kaggle Healthcare Dataset, Healthcare Cost and Utilization Project (HCUP), National Health and Nutrition Examination Survey (NHANES), or other CDC datasets. Always be mindful of data privacy (HIPAA in the US) when working with real healthcare data; synthetic datasets are safer for portfolio projects.
- Database Setup and Data Loading: Create your database and tables (e.g., Patients, Admissions, Diagnoses, Procedures, Billing) and load the data.
- Data Cleaning and Validation:
- Handle missing or inconsistent data, especially in diagnosis codes or billing amounts.
- Ensure data types are correct for numerical and date fields.
- Exploratory Analysis:
- Identify the most common medical conditions or diagnoses.
- Analyze patient demographics (age, gender, region) in relation to conditions.
- Determine which hospitals handle the most patients or specific conditions.
- Analyze billing amounts by condition, admission type, or hospital.
- Calculate average length of hospital stay for different conditions.
- Advanced Analytics (Optional):
- Investigate correlations between patient demographics and health outcomes.
- Analyze readmission rates for specific conditions or hospitals.
- Identify potential areas for cost reduction or efficiency improvement.
- Reporting Insights: Present your findings on common health issues, resource utilization, or cost variations.
This project demonstrates your ability to handle sensitive and complex data, making it valuable for roles in healthcare analytics, public health, or any domain requiring careful data governance. Insights from such analyses can feed into AI models for disease prediction, patient risk stratification, or optimizing hospital operations.
To successfully complete these projects, you'll need a few key tools:
- Database Management System (DBMS): Choose one that suits your learning goals. Popular options include:
- SQL Client/IDE: Tools like DBeaver, VS Code with SQL extensions, or specific tools for your chosen DBMS (e.g., SSMS for SQL Server) will help you write and execute queries.
- Datasets: As mentioned, Kaggle, the UCI Machine Learning Repository, data.gov, and Maven Analytics Data Playground are excellent sources for free, real-world datasets.
- Version Control: Use GitHub to store your SQL scripts, project documentation, and any insights you generate. This shows employers your coding practices and project management skills.
Final Thoughts
Building a robust data portfolio with these SQL projects will not only enhance your technical skills but also demonstrate your ability to think critically and solve real-world problems. Each project offers unique learning opportunities and allows you to apply different SQL techniques. Remember to document your process, explain your results clearly, and highlight the business insights you uncover. This practical experience is invaluable, not just for landing a job, but for building a strong foundation for future work in advanced data analytics, machine learning, and artificial intelligence.
Frequently Asked Questions
What is the best way to get started with these SQL projects if I'm a beginner?
Start with a project that interests you and has readily available, clean data, like sales analysis or customer churn. Focus on mastering fundamental SQL concepts such as filtering, grouping, aggregating, and joining tables. As you gain confidence, gradually move to more complex projects involving CTEs, window functions, and data warehousing principles. Platforms like Kaggle often provide guided projects or beginner-friendly datasets.
Where can I find suitable datasets for these projects?
Excellent sources for free, real-world datasets include Kaggle (for a wide variety of topics including sales, churn, and banking), the UCI Machine Learning Repository (for classification and regression datasets), data.gov (for government and public health data), and the Maven Analytics Data Playground. Always check the dataset's license and terms of use.
How can these SQL projects help me prepare for a career in AI or Machine Learning?
SQL is a foundational skill for AI/ML roles because data preparation is a significant part of any machine learning workflow. These projects teach you how to extract, clean, transform, and aggregate data, which are crucial steps before feeding data into AI/ML models. Projects like customer churn analysis involve feature engineering and data segmentation, directly supporting the development of predictive models. Data warehousing skills are also essential for managing the large datasets often used in AI/ML applications.
Should I include my SQL code in my portfolio?
Absolutely! Include your SQL scripts, clearly commented and well-formatted, in a public GitHub repository. Beyond the code, also provide a clear explanation of the business problem, your methodology, the insights you gained, and any recommendations. You can also include screenshots of your database schema or any visualizations you created based on your SQL analysis. This holistic approach demonstrates your end-to-end analytical abilities.