Key Takeaways
- Understanding user intent requires going beyond simple click counts and demographics to analyze complex behavioral patterns.
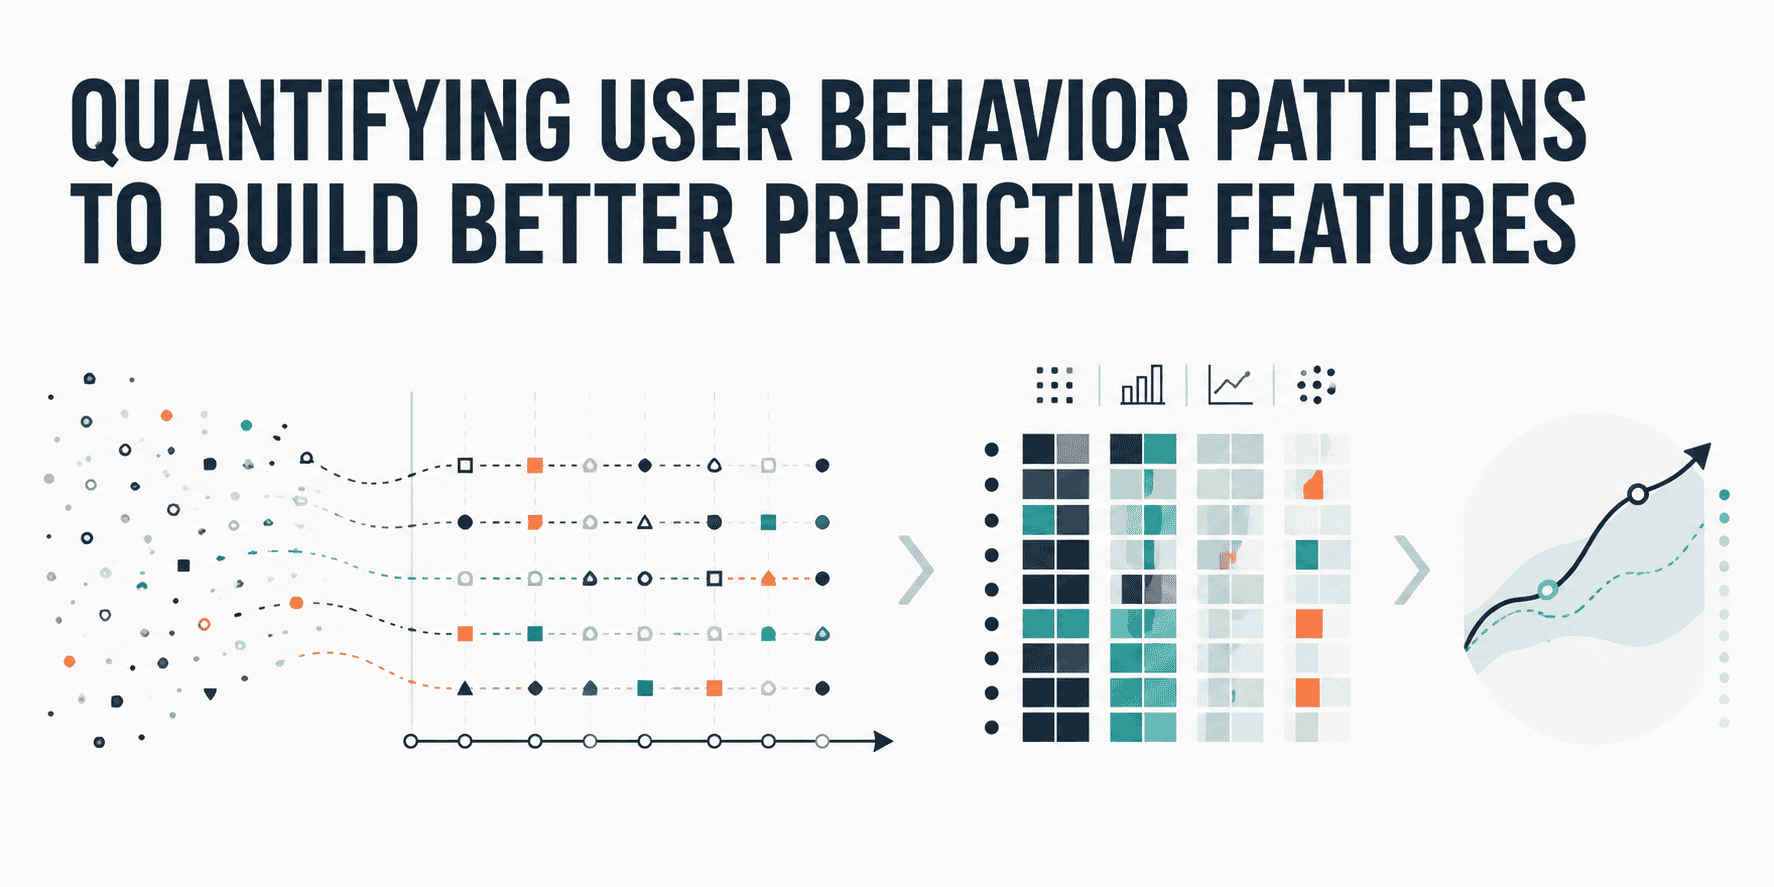
- Feature engineering is crucial for transforming raw user event data into meaningful, predictive signals for machine learning models.
- Key techniques include creating time-based, sequence-based, and aggregated features that capture velocity, frequency, recency, and contextual information.
- Leverage Python libraries like Pandas, Scikit-learn, Featuretools, and tsfresh to efficiently extract and manage these complex features from time-series user data.
Unlocking User Intent: A Tutorial on Building Better Predictive Features from Behavior Patterns
Knowing that a "35-year-old male in Seattle clicked 12 times last month" tells you almost nothing about his actual intent or what he's likely to do next. This is a common challenge in data science and machine learning: raw, aggregate user data often lacks the nuance needed to build truly predictive models. To move beyond superficial metrics and understand the "why" behind user actions, we need to quantify complex user behavior patterns. This tutorial will guide you through the process of transforming raw user event streams into powerful predictive features.Why Simple Metrics Fall Short
Traditional analytics often rely on basic metrics like total clicks, page views, or time spent on a page. While these provide a high-level overview, they miss critical details. Imagine two users who both clicked 12 times on an e-commerce site last month:- User A clicked 12 times in a single frantic session, adding items to their cart, abandoning it, and then returning later to complete a purchase.
- User B clicked 12 times spread out over the entire month, visiting a different product page each day, never adding anything to their cart.
Step 1: Define Your Goal and Data Sources
Before diving into data, clearly define what you want to predict. Are you trying to:- Predict user churn?
- Forecast conversion to a paid subscription?
- Recommend the next best product or content?
- Identify fraudulent activity?
- Event logs: Clicks, page views, searches, adds-to-cart, video plays, form submissions. These usually include a user ID, timestamp, and event type.
- Application databases: User profiles, purchase history, subscription status.
- External data: Demographic information, geographic location (though be mindful of privacy and ethical considerations).
Step 2: Understand Your Raw User Event Data
User behavior data is often sequential and time-dependent. It's essentially a time series where each item (event) might depend on what came before it. You'll typically have event logs that look something like this:| user_id | timestamp | event_type | page_id | product_id |
|---|---|---|---|---|
| U101 | 2026-08-01 09:00:15 | page_view | home | null |
| U101 | 2026-08-01 09:01:30 | product_view | product_detail | P505 |
| U101 | 2026-08-01 09:03:00 | add_to_cart | product_detail | P505 |
| U102 | 2026-08-01 10:15:20 | page_view | home | null |
| U101 | 2026-08-01 10:30:45 | purchase | checkout | P505 |
Step 3: Feature Engineering: Beyond Simple Counts
This is the core of quantifying user behavior. Feature engineering transforms raw data into variables that machine learning models can understand and learn from. It's about extracting meaningful information and patterns. Here are core techniques to turn raw event streams into features:3.1 Time-Based Features
These features capture the temporal dynamics of user interactions.-
Recency: How long has it been since the user's last interaction?
Example: Days since last login, hours since last purchase. More recent activity often indicates higher engagement.
-
Frequency: How often does a user perform a specific action within a given time window?
Example: Number of logins in the last 7 days, clicks per session, number of distinct products viewed in the last hour.
-
Duration: How long does a user spend on a page or within a session?
Example: Average session duration, total time spent on product detail pages.
-
Time of day/week/month: Capture seasonality and temporal patterns.
Example: Hour of the day, day of the week, month of the year for events. Is a user more active during work hours or evenings? Does activity spike on weekends?
-
Time between events: The interval between consecutive actions.
Example: Average time between a product view and an add-to-cart action. This can indicate hesitation or quick decision-making.
3.2 Behavioral Velocity and Intensity
Velocity captures the speed and intensity of behavior over specific time intervals.-
Action frequency within sliding windows: Calculate how many times an action occurs within hourly, daily, or session-based windows.
Example: Number of searches in the last 10 minutes. Someone who submits five queries in 10 minutes exhibits a different intent than someone who spreads five queries over a week.
-
Rate of change: How is a user's activity accelerating or decelerating?
Example: Change in daily login count week-over-week. A sudden drop might signal disengagement.
3.3 Sequence and Path-Based Features
These features capture the order and flow of user actions, which are crucial for understanding intent.-
Event sequences: What is the typical order of events leading to a target action?
Example: Did the user view a product, then add to cart, then purchase? Or did they view, then view another, then add to cart?
-
Funnel position: Where is the user in a predefined conversion funnel?
Example: Is the last event in a session a checkout?
-
N-grams of events: Treat sequences of events like text and extract common "phrases" of actions.
Example: The sequence "product_view -> add_to_cart -> checkout" could be a strong signal for purchase intent.
-
Path analysis: Track common navigation paths.
Example: Page A to Page B transitions.
3.4 Aggregations and Ratios
Combine existing data points to create more informative features.- Count-based features: Total clicks, views, distinct pages visited.
-
Ratios: These often provide more context than raw counts.
Example: Click-through rate (clicks/views), add-to-cart to purchase conversion rate.
-
User-level aggregates over multiple sessions:
Example: Average session duration, Recency, Frequency, Monetary (RFM) values, time since last session.
3.5 Contextual and Interaction Features
Consider external factors or interactions between features.- Device/OS information: Are users on mobile more likely to churn?
- Referral source: Does traffic from a specific source convert better?
-
Interaction features: Combine two or more features to capture non-linear relationships.
Example: `(time_spent_on_product_page)
• (number_of_reviews_read)` might be more predictive than either feature alone.
Leveraging Python Libraries for Feature Engineering
For efficient feature engineering, especially with large datasets, Python offers powerful libraries:- Pandas: Essential for data manipulation, grouping, and aggregation.
- Scikit-learn: Provides tools for preprocessing, scaling, and encoding features.
- Featuretools: An open-source library that automates feature engineering, particularly useful for relational and time-series data. It uses Deep Feature Synthesis (DFS) to generate new features by analyzing relationships.
- tsfresh: Specifically designed for automatic feature extraction from time-series data, generating over 750 features.
- Feature-engine: A library for feature engineering that allows selecting variables for transformation and integrates with Scikit-learn pipelines.
- Dask: For datasets exceeding single-machine RAM, Dask allows parallel computing across clusters, mimicking the Pandas API for scalable operations.
- NVTabular: From NVIDIA, this library uses GPU acceleration for preprocessing and feature engineering on massive tabular datasets, ideal for large-scale recommendation systems.
Step 4: Handling Time-Series and Sequential Data
User behavior is inherently a time series. When building predictive features, you often need to consider past events to predict future ones.-
Lag Features: Use values from previous time steps as features.
Example: A user's average spending in the last 3 days to predict today's purchase.
-
Windowed Aggregations: Calculate statistics (mean, sum, standard deviation) over rolling time windows.
Example: Rolling average of clicks over the last 24 hours, sum of items added to cart in the last 7 days.
- State Transitions: Model user journeys as transitions between states (e.g., "browsing" to "cart" to "checkout").
- Embeddings: For complex sequences of categorical events (like page IDs or product IDs), techniques like Word2Vec (adapted for sequences) can create numerical representations (embeddings) that capture semantic relationships between events.
Step 5: Feature Selection and Validation
Once you've engineered a rich set of features, not all of them will be equally useful. Too many features can lead to overfitting and slower model training. Feature selection is the process of identifying and keeping only the input features that contribute most to accurate predictions.- Correlation analysis: Remove highly correlated features.
- Feature importance: Use tree-based models (like Random Forests or Gradient Boosting) to identify which features are most important for your prediction task.
- Dimensionality reduction: Techniques like Principal Component Analysis (PCA) can reduce the number of features while retaining most of the information.
- Domain knowledge: Always use your understanding of the business problem to guide feature selection.
Step 6: Model Training and Evaluation
With your engineered features, you're ready to train your machine learning model.- Choose an appropriate model: Depending on your problem (classification, regression), choose models like Logistic Regression, Random Forests, Gradient Boosting Machines (e.g., XGBoost, LightGBM), or even deep learning models for very complex sequential patterns.
- Train and evaluate: Split your data into training, validation, and test sets. Train your model on the training data, tune hyperparameters using the validation set, and finally evaluate its performance on unseen test data using relevant metrics (e.g., accuracy, precision, recall, F1-score for classification; RMSE, MAE for regression).
- Iterate: Feature engineering is an iterative process. If your model isn't performing as expected, revisit your features. Can you create new ones? Refine existing ones? Add more context?
Frequently Asked Questions
What is feature engineering in the context of user behavior?
Feature engineering in user behavior is the process of transforming raw user interaction data (like clicks, views, timestamps) into meaningful variables, or "features," that machine learning models can use to predict future actions or characteristics. It involves creating new features, aggregating existing ones, and encoding temporal patterns to capture user intent and engagement more effectively than simple counts.
Why are simple click counts not enough to understand user intent?
Simple click counts provide only a superficial view of user activity. They don't capture the sequence, timing, frequency, or context of clicks, which are crucial for understanding user intent. For example, 10 clicks in 5 minutes on related products indicates high interest, while 10 clicks spread over a month on disparate pages might not.
What types of features are most effective for quantifying user behavior patterns?
The most effective features often fall into categories such as time-based features (recency, frequency, duration, time between events), sequence-based features (event paths, funnels), behavioral velocity, and aggregated statistics (ratios, counts over rolling windows). Contextual features like device type or referral source can also add value.
What Python libraries are commonly used for feature engineering user behavior data?
Several Python libraries are popular for this task. Pandas is fundamental for data manipulation and aggregation. Scikit-learn offers preprocessing and encoding tools. For automated and advanced feature extraction from time-series and relational data, Featuretools and tsfresh are highly recommended. Dask and NVTabular can handle larger datasets by enabling distributed and GPU-accelerated computations, respectively.