Key Takeaways
- Building an end-to-end data science project goes beyond a Jupyter notebook, showcasing practical skills from data ingestion to deployment.
- A complete project demonstrates proficiency in data acquisition, cleaning, EDA, model development, evaluation, and crucial deployment strategies.
- Key tools for deployment include web frameworks like Flask or FastAPI, interactive libraries like Streamlit, and containerization with Docker.
- Deploying your project on cloud platforms such as AWS, GCP, or Azure provides real-world experience and makes your work accessible.
In the competitive world of data science, a portfolio is your most powerful resume. But let's be honest: many data science portfolios stop short. They showcase impressive Jupyter notebooks filled with brilliant analyses and well-trained models, yet often lack the crucial "end-to-end" component. This means the project isn't fully operational; it doesn't solve a real-world problem in an accessible way. If you want to stand out, it's time to take your projects all the way from raw data to a deployed, interactive application.
This tutorial will guide you through building a truly end-to-end data science portfolio project. We'll cover everything from getting your data to making your model available to others, focusing on practical steps and widely used tools. By the end, you'll have a blueprint for transforming your static notebooks into dynamic, showcase-worthy applications.
Why Go End-to-End?
A well-executed end-to-end project demonstrates a comprehensive skill set that employers actively seek. It proves you can:
- Handle Real-World Data: From messy raw data to clean, usable formats.
- Build Robust Models: Not just experimenting, but developing models that perform well in a production-like environment.
- Engineer Solutions: Translate a data science problem into a functional application.
- Understand Deployment: Make your work accessible and useful beyond your local machine.
- Communicate Value: Show how your insights can be operationalized and deliver tangible results.
Think of it this way: a Jupyter notebook is like a chef's recipe book. An end-to-end project is like a fully catered meal, served fresh and ready to enjoy.
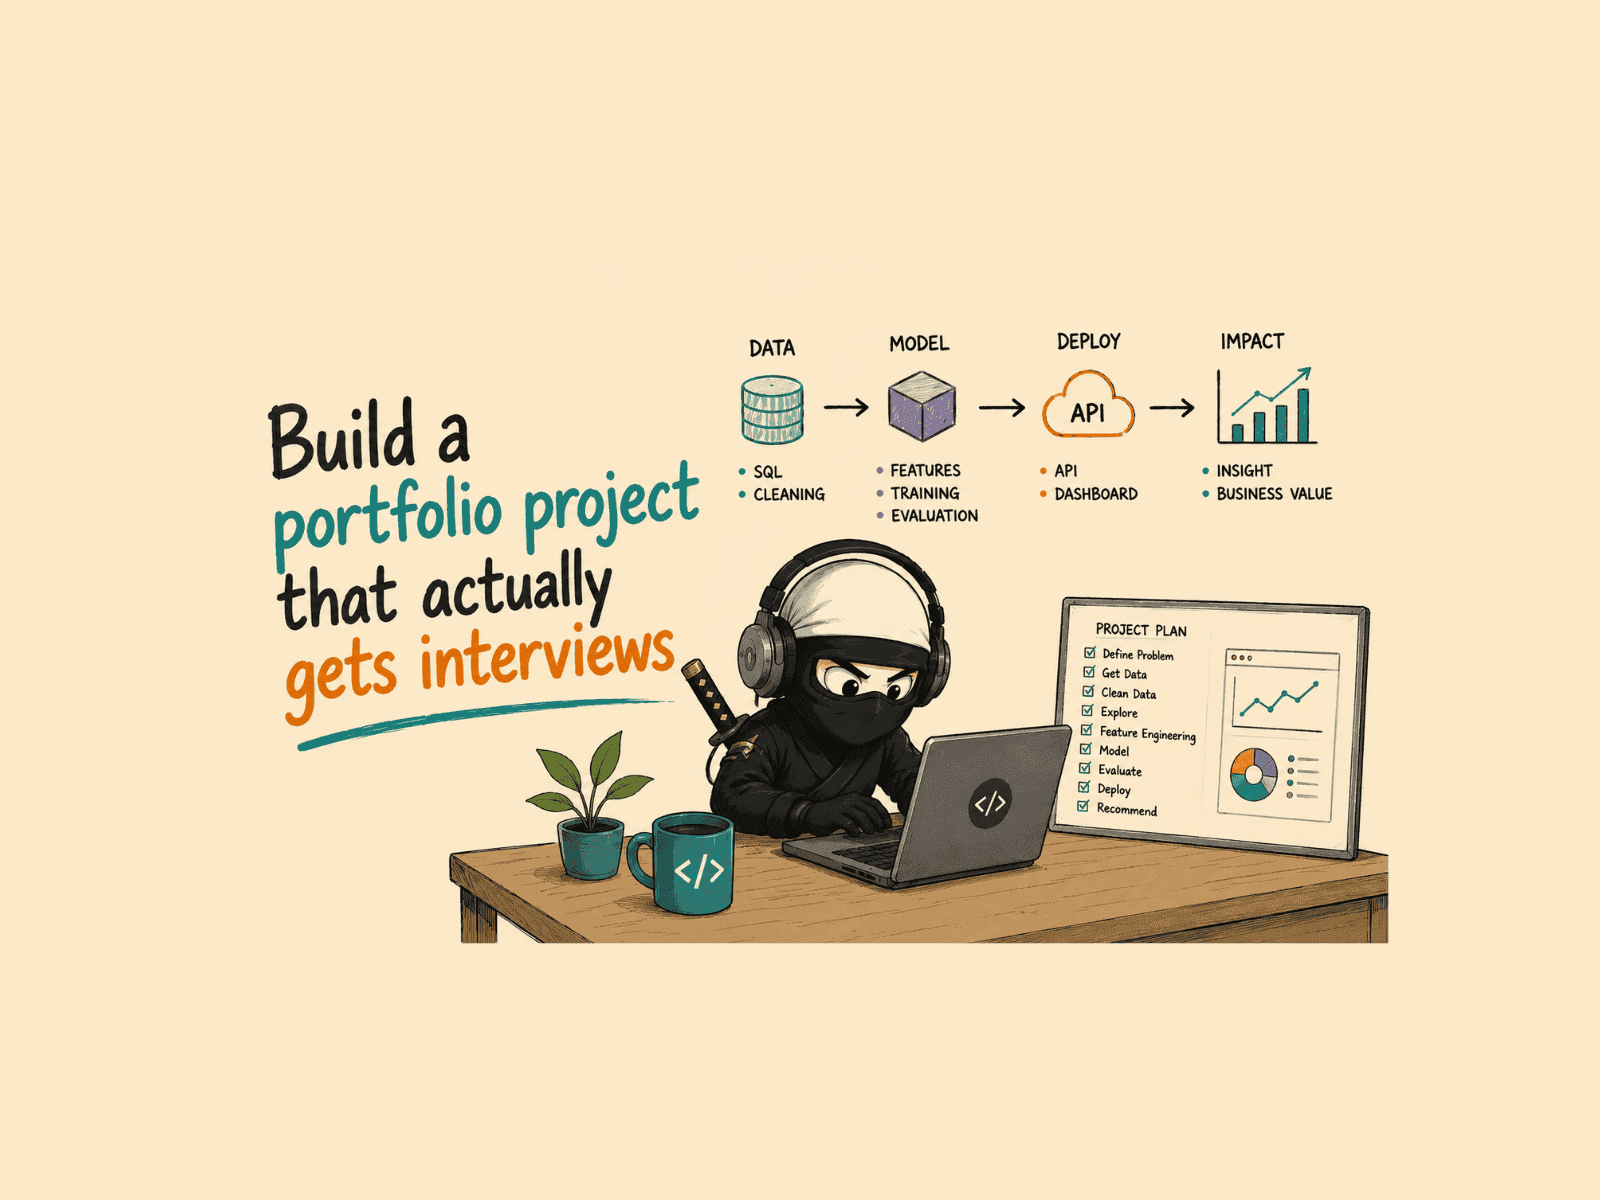
The End-to-End Data Science Project Workflow
An end-to-end project typically follows these stages:
- Data Acquisition
- Data Cleaning and Preprocessing
- Exploratory Data Analysis (EDA)
- Model Building and Training
- Model Evaluation
- Deployment
- Monitoring (Optional, but highly recommended for real-world projects)
Let's dive into each step with practical examples and tools.
Step 1: Data Acquisition – Getting Your Hands on the Data
The first step is always to find and gather the data you need. For a portfolio project, aim for data that's interesting, publicly available, and reasonably complex to allow for meaningful analysis.
Use Cases & Tools:
- Public APIs: Many organizations offer APIs to access their data. Examples include Twitter API for social media data, OpenWeatherMap API for weather data, or various government data portals.
- Web Scraping: When no API is available, you might need to scrape data from websites. Tools like Beautiful Soup (for parsing HTML/XML) and Scrapy (a powerful web crawling framework) in Python are excellent choices.
- Public Datasets: Platforms like Kaggle, UCI Machine Learning Repository, or government data sites (e.g., data.gov) offer a wealth of ready-to-use datasets.
- Databases: If you have access to a database, you'll use SQL queries to extract data. Libraries like
psycopg2for PostgreSQL ormysql-connector-pythonfor MySQL can connect Python to databases.
Example Snippet (using requests for an API):
import requests
import json

# Example: Fetching data from a public API (replace with a real API endpoint)
api_url = "https://api.example.com/data" # Placeholder URL
headers = {"Authorization": "Bearer YOUR_API_KEY"} # If authentication is needed

try:
    response = requests.get(api_url, headers=headers)
    response.raise_for_status() # Raise an HTTPError for bad responses (4xx or 5xx)
    data = response.json()
    print("Data fetched successfully!")
    # You might save this to a file or process it further
    with open("raw_data.json", "w") as f:
        json.dump(data, f, indent=4)
except requests.exceptions.RequestException as e:
    print(f"Error fetching data: {e}")
Step 2: Data Cleaning and Preprocessing – Making Sense of the Mess
Raw data is rarely perfect. This stage involves handling missing values, correcting inconsistencies, transforming data types, and preparing features for model training.
Use Cases & Tools:
- Handling Missing Values: Imputation (mean, median, mode), deletion of rows/columns.
- Outlier Detection and Treatment: Statistical methods, visualization.
- Feature Engineering: Creating new features from existing ones (e.g., combining columns, extracting date components).
- Encoding Categorical Data: One-hot encoding, label encoding.
- Scaling Numerical Features: Standardization (
StandardScaler) or normalization (MinMaxScaler) for algorithms sensitive to feature scales.
The Pandas library is your best friend here, along with NumPy for numerical operations and scikit-learn's preprocessing modules.
Example Snippet (using Pandas and scikit-learn):
import pandas as pd
from sklearn.model_selection import train_test_split
from sklearn.preprocessing import StandardScaler, OneHotEncoder
from sklearn.compose import ColumnTransformer
from sklearn.pipeline import Pipeline

# Load your raw data (assuming it's in a CSV)
df = pd.read_csv("raw_data.csv")

# Identify numerical and categorical features
numerical_features = ['age', 'income', 'loan_amount']
categorical_features = ['gender', 'education', 'marital_status']

# Create preprocessing pipelines for numerical and categorical features
numerical_transformer = StandardScaler()
categorical_transformer = OneHotEncoder(handle_unknown='ignore')

# Create a preprocessor using ColumnTransformer
preprocessor = ColumnTransformer(
    transformers=[
        ('num', numerical_transformer, numerical_features),
        ('cat', categorical_transformer, categorical_features)
    ])

# Example: Splitting data and applying preprocessing
X = df.drop('target_column', axis=1)
y = df['target_column']
X_train, X_test, y_train, y_test = train_test_split(X, y, test_size=0.2, random_state=42)

# Fit and transform the training data, then transform test data
X_train_processed = preprocessor.fit_transform(X_train)
X_test_processed = preprocessor.transform(X_test)

print("Data cleaning and preprocessing complete.")
Step 3: Exploratory Data Analysis (EDA) – Understanding Your Data
EDA is about visualizing and summarizing your data to uncover patterns, spot anomalies, and test hypotheses. This helps you choose the right models and features.
Use Cases & Tools:
- Distributions: Histograms, box plots to understand feature distributions.
- Relationships: Scatter plots, correlation matrices to see how features relate to each other and the target.
- Insights: Identify trends, seasonality, and potential data quality issues.
Matplotlib and Seaborn are standard Python libraries for static plots, while Plotly and Altair are great for interactive visualizations. For automated EDA, consider Pandas Profiling.
Step 4: Model Building and Training – The Core of Prediction
This is where you select and train machine learning models. The choice of model depends heavily on your problem (classification, regression, clustering) and the nature of your data.
Use Cases & Tools:
- Classification: Predict categories (e.g., spam/not spam, disease/no disease). Algorithms: Logistic Regression, Support Vector Machines (SVM), Random Forest, Gradient Boosting (XGBoost, LightGBM).
- Regression: Predict continuous values (e.g., house prices, stock prices). Algorithms: Linear Regression, Ridge, Lasso, Decision Trees, Random Forest Regressor.
- Clustering: Group similar data points (e.g., customer segmentation). Algorithms: K-Means, DBSCAN.
Scikit-learn is the go-to library for traditional machine learning models. For deep learning, TensorFlow and PyTorch are industry standards.
Example Snippet (using scikit-learn for a simple classification model):
from sklearn.ensemble import RandomForestClassifier
from sklearn.metrics import accuracy_score

# Assuming X_train_processed, X_test_processed, y_train, y_test are ready from Step 2

# Initialize and train a RandomForestClassifier
model = RandomForestClassifier(n_estimators=100, random_state=42)
model.fit(X_train_processed, y_train)

print("Model trained successfully.")
Step 5: Model Evaluation – How Good is Your Model?
After training, you need to rigorously evaluate your model's performance on unseen data to ensure it generalizes well and isn't just memorizing the training data.
Use Cases & Tools:
- Classification Metrics: Accuracy, Precision, Recall, F1-score, ROC-AUC, Confusion Matrix.
- Regression Metrics: Mean Squared Error (MSE), Root Mean Squared Error (RMSE), Mean Absolute Error (MAE), R-squared.
- Cross-Validation: Techniques like K-fold cross-validation provide a more robust estimate of model performance.
Scikit-learn's metrics module provides all the necessary functions for evaluation.
Example Snippet (evaluating the RandomForestClassifier):
# Make predictions on the test set
y_pred = model.predict(X_test_processed)

# Calculate accuracy
accuracy = accuracy_score(y_test, y_pred)
print(f"Model Accuracy on Test Set: {accuracy:.4f}")

# You'd typically look at more metrics like precision, recall, F1-score, etc.
from sklearn.metrics import classification_report
print("\nClassification Report:")
print(classification_report(y_test, y_pred))
Step 6: Deployment – Making Your Project Accessible
This is the "end" in "end-to-end." Deployment means taking your trained model and making it available for others to use, often through a web application or an API. This is where many portfolio projects fall short, and where you can truly shine.
Key Deployment Strategies & Tools:
- Building a Web API:
- Flask: A lightweight Python web framework perfect for creating simple REST APIs to serve your model predictions. You send data to the API, and it returns a prediction. Flask Official Documentation
- FastAPI: A modern, fast (high-performance) web framework for building APIs with Python 3.7+ based on standard Python type hints. It automatically generates API documentation (Swagger UI/ReDoc). FastAPI Official Documentation
- Building an Interactive Web Application:
- Streamlit: A fantastic library for rapidly building interactive data apps purely in Python, without needing front-end skills. It's incredibly popular for data science demos. Streamlit Official Website
- Dash: Built on top of Flask, Plotly.js, and React.js, Dash is ideal for building analytical web applications. It requires a bit more effort than Streamlit but offers greater customization. Dash Official Website
- Containerization with Docker:
- Docker: Package your application (code, libraries, dependencies, model files, and even the operating system) into a lightweight, portable container. This ensures your application runs consistently across different environments (your machine, a server, the cloud). Learning Docker is a huge plus for any developer. Docker Official Website
- Cloud Deployment:
- AWS (Amazon Web Services): Services like AWS Elastic Beanstalk (for web apps), AWS EC2 (virtual servers), or AWS SageMaker (managed machine learning platform) are popular choices.
- Google Cloud Platform (GCP): Google App Engine, Google Compute Engine, or Google Cloud AI Platform are excellent for deploying machine learning models and applications.
- Azure Machine Learning: Microsoft's cloud platform offers comprehensive tools for building, training, and deploying ML models.
Example Snippet (basic Flask API structure):
# app.py (Flask application)
from flask import Flask, request, jsonify
import joblib # To load your trained model and preprocessor

app = Flask(__name__)

# Load your pre-trained model and preprocessor
# Make sure these files are in your project directory
model = joblib.load('model.pkl')
preprocessor = joblib.load('preprocessor.pkl')

@app.route('/predict', methods=['POST'])
def predict():
    data = request.get_json(force=True) # Get data posted as JSON

    # Example: convert input data to DataFrame for preprocessing
    # This structure depends on your original input features
    input_df = pd.DataFrame([data])

    # Preprocess the input data
    processed_input = preprocessor.transform(input_df)

    # Make prediction
    prediction = model.predict(processed_input)

    # Return prediction as JSON
    return jsonify({'prediction': int(prediction)})

if __name__ == '__main__':
    app.run(debug=True, host='0.0.0.0', port=5000)
To make this work, you would first save your trained model and preprocessor objects using joblib.dump(model, 'model.pkl') and joblib.dump(preprocessor, 'preprocessor.pkl') after training.
Step 7: Monitoring (Optional for Portfolio, Essential for Production)
While often skipped for portfolio projects, real-world deployed models require monitoring. This involves tracking model performance over time, detecting data drift, and ensuring the application remains healthy.
Use Cases & Tools:
- Performance Metrics: Track accuracy, latency, error rates.
- Data Drift: Monitor changes in input data distribution that could degrade model performance.
- Logging: Use libraries like Python's
loggingmodule to record events and errors. - Dashboarding: Tools like Grafana or custom dashboards built with Streamlit can visualize monitoring data.
Making Your Portfolio Project Shine
- Clear Documentation: A well-written
README.mdon your GitHub repository explaining the project's goal, data sources, methodology, how to run it, and a link to the live demo. - Clean Code: Follow best practices, use clear variable names, and add comments where necessary.
- Version Control: Use Git and GitHub from day one.
- Live Demo Link: Include a direct link to your deployed application so recruiters can interact with it immediately.
- Blog Post/Walkthrough: Write a separate blog post (like this one!) detailing your project, the challenges you faced, and how you overcame them.
Final Thoughts
Moving beyond the notebook and building an end-to-end data science project is a significant step in your career. It demonstrates not just theoretical knowledge but practical engineering skills, problem-solving abilities, and a deep understanding of how data science delivers real value. So, pick an interesting problem, gather your tools, and start building something truly impressive!
Frequently Asked Questions
What is an "end-to-end" data science project?
An end-to-end data science project covers the entire lifecycle of a data science problem, starting from data collection and cleaning, through model development and evaluation, all the way to deploying the model as a functional application or API that users can interact with. It goes beyond just developing a model in a notebook.
Why is building an end-to-end project important for a data science portfolio?
It's crucial because it demonstrates a comprehensive skill set that employers look for. It shows you can not only build models but also handle real-world data challenges, engineer solutions, and make your work accessible and useful, proving you can operationalize machine learning.
What are some common tools used for deploying data science models?
For building web APIs, popular choices include Flask and FastAPI. For creating interactive web applications, Streamlit and Dash are widely used. To package and ensure consistency across environments, Docker is essential. For cloud hosting, platforms like AWS, Google Cloud Platform, and Azure offer various services for deployment.
Do I need to deploy my project to the cloud?
While not strictly mandatory for every portfolio project, deploying to a cloud platform (like AWS, GCP, or Azure) is highly recommended. It provides invaluable experience with cloud infrastructure, makes your project globally accessible, and demonstrates your ability to work with industry-standard deployment environments. For simple demos, free tiers or services like Streamlit Cloud can be a great starting point.